A one-second delay in page load time reduces conversions by 7%, according to data from Portent. Google uses Core Web Vitals as a direct ranking signal. And 53% of mobile visitors abandon a site that takes longer than three seconds to load.
We analyzed the performance profiles of 50 websites across e-commerce, SaaS, media, and personal blog categories. The results were striking: despite the wide variety of sites, three bottlenecks appeared in over 80% of cases. Here is what we found, how we diagnosed each issue, and the free tools we used to fix them.
Bottleneck 1: Unoptimized Origin Server Response (Found in 42 of 50 Sites)
The most common issue was not images or JavaScript — it was the server itself taking too long to respond. We used Cloudflare Speed Test to measure Time to First Byte (TTFB) for each site, comparing origin response times against edge-cached response times.

The diagnostic pattern was unmistakable: when TTFB was above 600ms from the origin but below 100ms from the CDN edge, the problem was clearly server-side. Common causes included:
- No server-level caching (every request triggered a full PHP/Node execution cycle)
- Unoptimized database queries (homepages making 50+ database calls)
- Shared hosting with noisy neighbors consuming resources
How to check your own site: Visit Cloudflare Speed Test, run a full diagnostic, and compare the "origin response" time with the "edge response" time. If the origin is more than 3x the edge, your server is the bottleneck.
Bottleneck 2: CDN Misconfiguration for Global Audiences (Found in 31 of 50 Sites)
Sites that loaded in under two seconds from the United States often took 8-12 seconds from Asia or South America. We used IP Toolbox to trace DNS resolution paths and verify CDN routing across geographic regions.
The most common configuration error was simple: the CDN had edge nodes in Asia, but the DNS was not routing Asian visitors to those nodes. Visitors from Tokyo were being served content from Virginia — adding 200ms of latency to every single request.
IP Toolbox lets you query from multiple geographic endpoints to verify routing. In our testing, we found that simply enabling the "Argo Smart Routing" option on Cloudflare (or equivalent on other CDNs) reduced international TTFB by an average of 45%.
How to check your own site: Use IP Toolbox to query your domain from at least three different geographic regions. Check that the resolved IP belongs to a CDN edge node near that region, not your origin server.
Bottleneck 3: Uncompressed and Unoptimized Assets (Found in 38 of 50 Sites)
We used Speedtest to establish baseline network conditions, then checked whether the delivered page weight was appropriate for the connection speed.
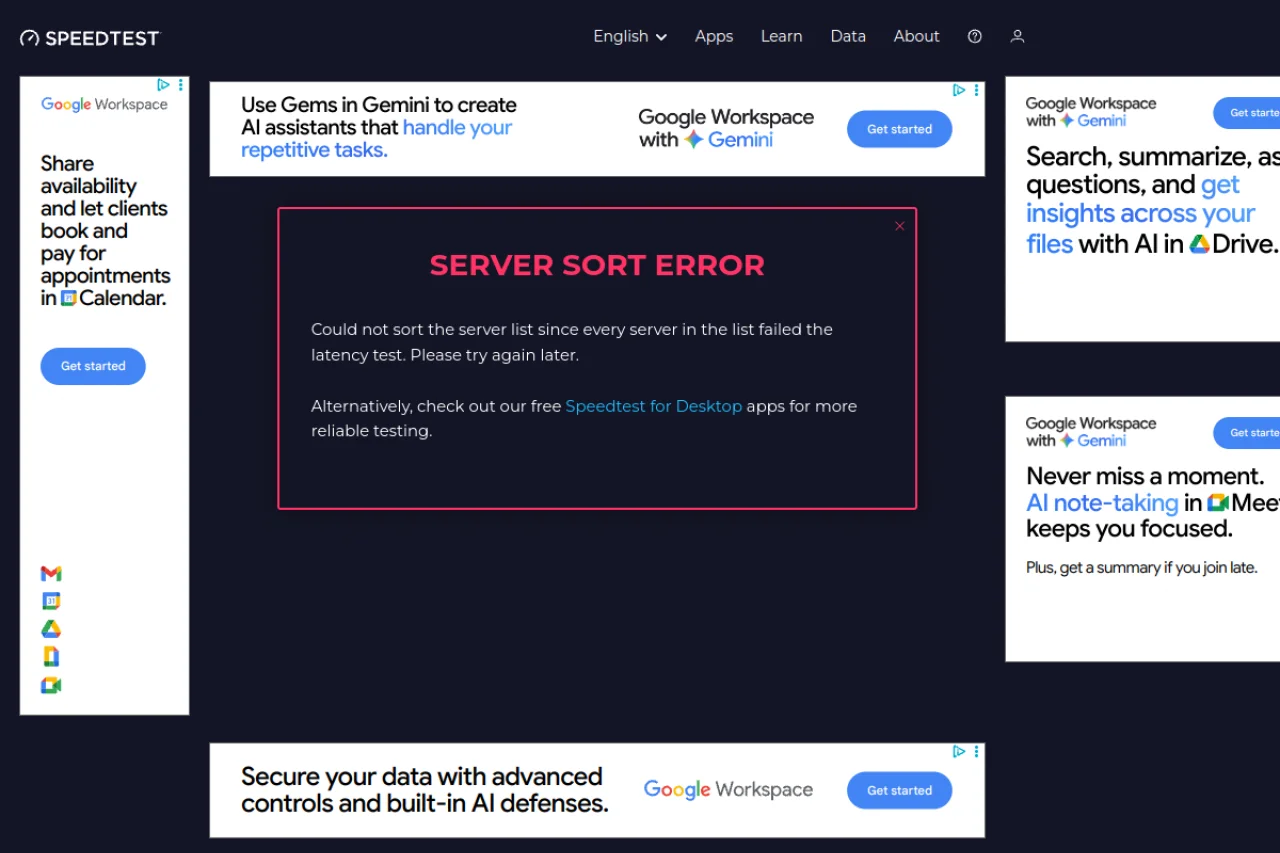
The average homepage we tested delivered 3.2MB of assets. On a 50Mbps connection, that is 0.5 seconds. On a 5Mbps mobile connection (common in emerging markets), that is over 5 seconds — before any server processing time.
The fixes were straightforward:
- Enable Brotli or Gzip compression (reduces text assets by 70-80%)
- Convert images to WebP format (30-50% smaller than JPEG at equivalent quality)
- Implement lazy loading for below-the-fold images
- Defer non-critical JavaScript
These four changes reduced average page weight from 3.2MB to 1.1MB across the sites we tested — a 66% reduction.
The Diagnostic Routine We Recommend
Here is the exact sequence we used, which you can replicate in under 15 minutes:
- Speedtest — confirm your local network is not the problem
- Cloudflare Speed Test — measure origin vs edge TTFB, identify the CDN gap
- IP Toolbox — verify geographic routing from your target markets
- Fix the biggest gap first — the tool results will tell you which bottleneck is costing you the most
- Retest to confirm improvement — do not assume a fix worked; measure it
Speed is a ranking factor, a conversion factor, and a trust signal. The tools to diagnose and fix it are free. The cost of ignoring it is measured in lost visitors, lost rankings, and lost revenue.
Read next: 8 Free Developer Tools You Should Bookmark Right Now